


Weather Widget System Architecture Design
Highlights
In 2021, we were contacted by a large international privately-held manufacturer and provider of irrigation products which are designed to minimize water consumption. They’ve been running a widget system on their control platform to provide their customers with data about current weather.
Challenge
Customer Challenge
Provide users of their product the ability to get full weather info from various areas, execute subscription and payments.
Project Challenge
Expand the functionality of a weather-providing system to adapt it for business use, considering its deploying for international market.
Solution
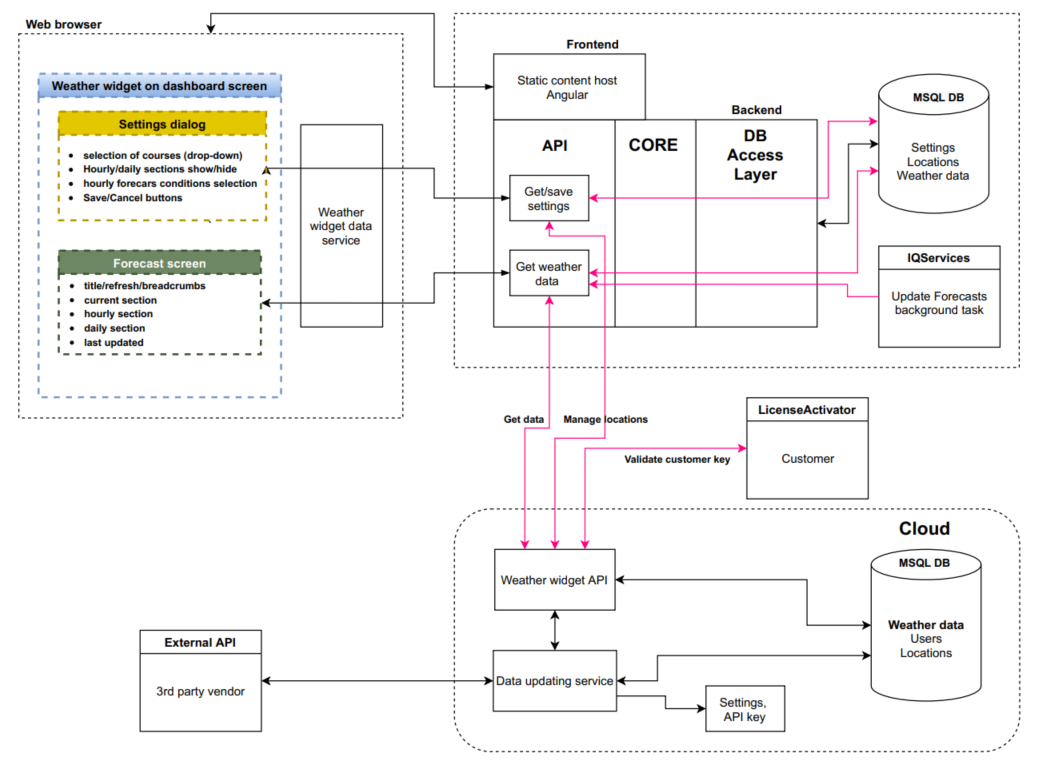
Our team developed a Web Widget for up-to-date Hyperlocal Weather information with regards to location. Users of the controller could add several widgets to the platform and see more weather info.While developing this app we used an agile methodology, and the development model was a mix of waterfall and spiral models. The delivered solution consists of 4 main structural elements on a high level:
- browser-based frontend part adapted for desktop and mobile platforms
- pc based backend core, API for interaction with frontend (considering fixed widget sizes) and cloud, and DB management services
- cloud-based data user and management service
- 3rd party weather information service
The selection of the technologies was determined by the fact that we developed the add-on for an existing piece of software, so it was an Angular framework for the frontend and .Net for backend-related parts.
After the start of the project, we realized that it would be nice for the client to validate the customer’s access to the widget and the information inside it. So, the challenge for the backend developer was to integrate an additional microservice with the initial software architecture. Thus, we had to create not just a specific widget, as planned initially, but an infrastructure that can be used by the client for adding any widget to the panel providing information from any 3rd party vendor.
To put the system of interaction with the weather data provider into a separate module, we decided to use a cloud solution. As a result, we got a separate server that downloaded weather data from a particular resource and transmitted it to end-users, provided with security settings and a licensing system. Thus, we have designed an infrastructure that allows the client to create widgets, control subscriptions and payments.
Our developers have also performed engineering and unit tests of the delivered solution. Over 70 e2e test cases were prepared and executed by the QA team. The project code was then pushed to the customer’s repository for future merge with the main product codebase.
As a result, the client received a system capable of displaying multiple weather widgets, allowing the operator to monitor up to 8 different weather parameters in various zones. Info in the widget system is presented in a readable form inside the in-app widget, split by hour, day and week. The solution supports automated and on-demand updates, cloud and local storage of historical data, and user validation.
Also, the client got a flexible platform for future implementation of different widgets which can obtain information from 3rd party vendors.
The delivered solution allowed not only to show the current state of the weather, but also to store, collect, and process data, turning the system into a full-fledged ecosystem of the Internet of Things.
Since the client sends solutions to more than 130 countries, it will not be difficult to internationalize the widget if necessary thanks to UI string values.
Development Included
- Building system infrastructure
- Architecture design
- New features implementation
- Backend development
- Frontend development
- Integration and functional testing
Results
-
Up to 8 parameters for monitoring in multiple locations
-
Adapted for use in 130 countries
-
Sales increased by 15% in 3 months
- Platform for future integrations of different widgets
Technology Breakdown
- 1.5 people
- May - September 2021